Using open source tools for Google Search Console and other JSON API dashboarding
January 2024
About the stack
- Grafana
- Google Search Console
- JSON APIs
- Docker Compose
Pairing Grafana (“The Open Observability Platform”) with Google Search Console data allows you to refine and transform your data, then share it with your clients or stakeholders.
Project at-a-glance
Escape Google Search Console's walled garden of performance insights to create reproducable reports based on the Google Search Console API.
Note: This approach only gets us better access to the data in GSC. Google’s 16-month data limit is still in effect, so you’ll need other solutions if you want to maintain and use data after that expiration date.
Why do I need another tool to access free GSC data?
Google Search Console has many limitations—among them, the irreproducable nature of any reports you create using the tool’s built-in dashboard. With some technical knowledge, it’s easy to filter data as you need and export to CSV, Google Sheets, etc. However, any permutations you make on that data will not be as reproducable or peer reviewable as those that you make with external tools. I’ve taken some easy roads and some hard roads to get around this issue, but for most users I would recommend the easy roads. For a tech-savvy SEO, I’d consider this one of the easier roads.
A tool like Grafana—”the open observability platform”—allows you to setup dashboards using data from external sources. In this case, we can connect to Google Search Console’s JSON API and gain access to most of the performance data available within GSC itself—plus gain the repeatability, sharability, and filterability of a third party tool.
How to setup Grafana for GSC
1. Setup a Google Cloud project to grant access to your Grafana instance.
Google has great documentation on how to create a Google Cloud project.
2. Install Grafana. I recommend self-hosting on a virtual private server.
For easy maintenance, I recommend installing Grafana on a virtual private server using a container system like docker. I’ve provided a docker compose example, but you’ll need to update for your own needs. This compose file assumes that you are using a separate caddy container to act as a reverse proxy, sharing data over the caddy-share bridge network. See caddy’s quick-start on setting up a reverse proxy to explore how you might implement a reverse proxy, or feel free to reach out to me with questions or for more examples.
version: "3.8"
services:
  grafana:
    image: grafana/grafana-enterprise
    container_name: grafana_app
    restart: unless-stopped
    volumes:
      - ./data/grafana-storage:/var/lib/grafana
      - ./data/grafana-custom-data:/grafana-custom-data
    environment:
      - GF_SERVER_ROOT_URL=YOUR URL
      - GF_AUTH_GOOGLE_ENABLED=true
      - GF_AUTH_GOOGLE_ALLOW_SIGN_UP=true
      - GF_AUTH_GOOGLE_AUTO_LOGIN=false
      - GF_AUTH_GOOGLE_CLIENT_ID=YOUR GOOGLE PROJECT CLIENT ID
      - GF_AUTH_GOOGLE_CLIENT_SECRET=YOUR GOOGLE PROJECT CLIENT SECRET
      - GF_AUTH_GOOGLE_SCOPES=openid email profile https://www.googleapis.com/auth/webmasters
      - GF_AUTH_GOOGLE_AUTH_URL=https://accounts.google.com/o/oauth2/v2/auth
      - GF_AUTH_GOOGLE_TOKEN_URL=https://oauth2.googleapis.com/token
      - GF_AUTH_GOOGLE_API_URL=https://openidconnect.googleapis.com/v1/userinfo
      - GF_AUTH_GOOGLE_USE_PKCE=true
      - GF_FEATURE_TOGGLES_ENABLE=formatString, addFieldFromCalculationStatFunctions, accessTokenExpirationCheck
      - GF_FEATURE_MANAGEMENT_ALLOW_EDITING=true
      - GF_RENDERING_SERVER_URL=YOUR URL/render
      - GF_RENDERING_CALLBACK_URL=YOUR URL
      - GF_LOG_FILTERS=rendering:debug
      - GF_SECURITY_ALLOW_EMBEDDING=true
    networks:
      - caddy-share
  renderer:
    image: grafana/grafana-image-renderer:latest
    container_name: grafana_renderer
    restart: unless-stopped
    networks:
      - caddy-share
networks:
  caddy-share:
    external: true
    driver: bridge
3. Sign in using Google single sign on
Once you’ve setup your contiainer properly, you should be able to sign in using Google’s single sign on and authorize your Google Cloud project to access your data.
4. Setup a Google Search Console connection
You can use the “JSON API” data connection to access Google search console data using the following options. This will use the credentials you signed into Grafana with to authorize with the GSC API. You can see a screenshot below in the project images section.
URL: https://www.googleapis.com/webmasters/v3/sites
Authentication method: Forward OAuth Identity
5. Add your GSC data to a dashboard
I highly recommend referencing the Google Search Console API reference docs to help build your query requests. However, I’ll provide an example to get started if you want to pull all your performance from a given time period—using the property domain/URL and dates as global variables.
fields:
    date:
        JSONPath: $[*].*.keys[0]
    clicks:
        JSONPath: $[*].*.clicks
    impressions:
        JSONPath: $[*].*.impressions
path:
    method: POST
    url: /${gsc_domain_properties}/searchAnalytics/query # NOTE the property domain is using a dashboard variable here, so you'll need to add an appropriate dashboard variable containing your GSC properties
You’ll also need to set a JSON body for your request. Something like the following will grab data with a date dimension matching the JSONPath I supplied above, and will filter for dates provided in the dashboard global settings.
{
        "startDate": "${__from:date:YYYY-MM-DD}",
        "endDate": "${__to:date:YYYY-MM-DD}",
        "dimensions": [
            "DATE"
        ]
    }
6. Use data transformations and different visualizations to show your data
You can use Grafana’s data transformations to adapt this data to your needs. For example, a common transformation I use is to aggregate traffic into rolling averages by date using Grafana’s Add field from calculation feature paired with the window functions mode. This helps me identify trends over extended periods of time, instead of relying on daily traffic data which can be very noisy.
Play around and find the best transformations for your data.
Project images

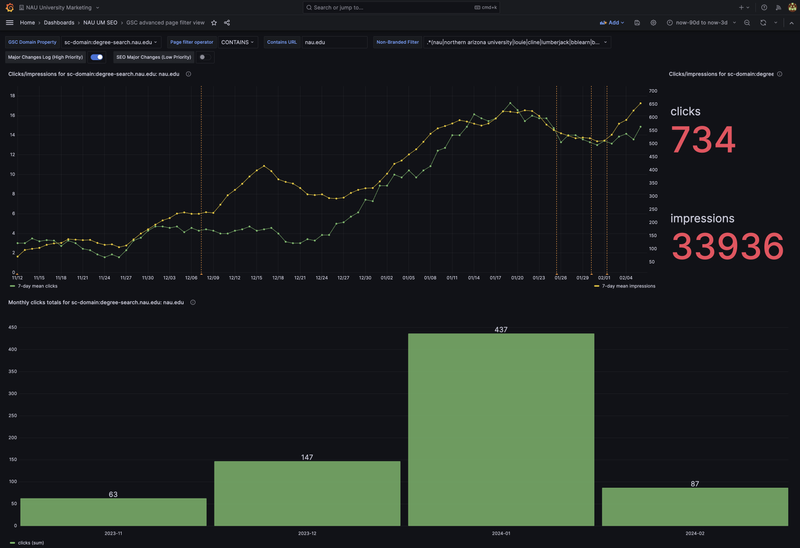
Screenshot of Grafana dashboard using Google Search Console APIs to visualize organic performance over time.

Grafana setup for connecting to the Google Search Console API using the "JSON API" data connection and "Forward OAuth Identity" from Google's SSO.

Screenshot of Grafana dashboard pulling live site list from WordPress multi-site network's JSON API as pre-set filters for GSC data.

Screenshot of Grafana dashboard using nocodb JSON APIs to visualize broken links strategy.